Proving the pipeline end-to-end - from Cloud Run to BigQuery to this chart.
Published
July 8, 2026
This is the first post through the full pipeline: a Cloud Run Job pulls pitch-level Statcast data daily and appends it to BigQuery, and this page reads straight from that table and renders a chart. Nothing here is a deep analytical claim yet - the point of this post is narrower and more important than that: confirming that data really does flow from the source all the way to a published page, with no manual step in between.
Querying the pipeline’s output
from google.cloud import bigqueryclient = bigquery.Client()query ="""SELECT pitch_type, COUNT(*) AS n_pitches, AVG(release_speed) AS avg_release_speed, AVG(release_spin_rate) AS avg_spin_rateFROM `maydaystats.mlb_statcast.pitches`WHERE pitch_type IS NOT NULLGROUP BY pitch_typeORDER BY n_pitches DESC"""df = client.query(query).to_dataframe()df = df.reset_index(drop=True)df.index +=1df
pitch_type
n_pitches
avg_release_speed
avg_spin_rate
1
FF
159534
94.774820
2313.671603
2
SI
86674
94.100157
2197.479382
3
SL
69849
86.281261
2435.344418
4
CH
58240
86.095400
1750.241792
5
ST
43201
82.888679
2598.387150
6
FC
41254
89.723392
2386.762502
7
CU
33426
80.148322
2597.180971
8
FS
16718
86.721127
1383.726264
9
KC
8523
82.611721
2517.919323
10
SV
2253
82.195251
2556.742451
11
EP
683
46.036164
1157.061856
12
FA
607
64.018451
1548.109453
13
FO
373
84.165684
927.576408
14
KN
195
76.924615
292.691429
15
CS
133
70.041353
2408.917293
16
PO
26
91.088462
2229.615385
17
UN
8
59.112500
1600.625000
As of this post, the table holds 521697 pitches across 17 distinct pitch types.
Average release speed by pitch type
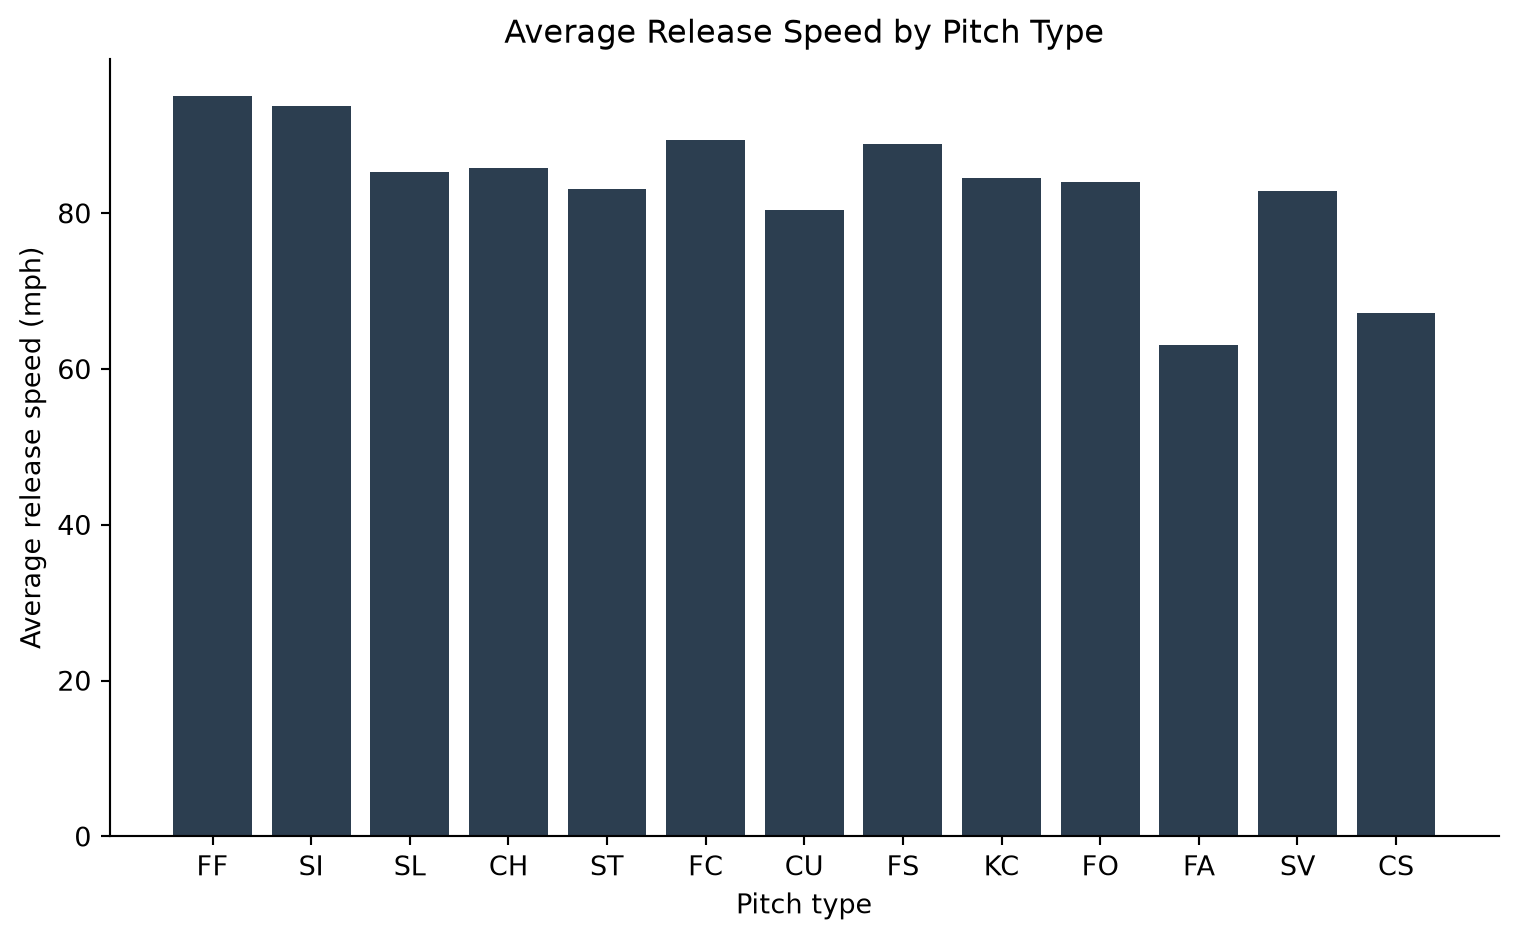
import matplotlib.pyplot as pltfig, ax = plt.subplots(figsize=(8, 5))ax.bar(df["pitch_type"], df["avg_release_speed"], color="#2c3e50")ax.set_xlabel("Pitch type")ax.set_ylabel("Average release speed (mph)")ax.set_title("Average Release Speed by Pitch Type")ax.spines[["top", "right"]].set_visible(False)plt.tight_layout()plt.show()
Figure 1: Average release speed by pitch type, all games loaded so far
What this confirms, and what’s next
Every number and every bar above came from a live query against mlb_statcast.pitches, which itself only exists because a Cloud Scheduler job triggers a Cloud Run Job every morning that pulls the previous day’s Statcast data. As more days accumulate, this same query pattern (and others like it) becomes the basis for real analysis rather than pipeline validation.
This post uses Quarto’s frozen execution (freeze: auto): the code above only re-runs when I re-render locally with fresh BigQuery access. The deployed site reuses that committed output rather than re-querying BigQuery on every build, which is what lets Cloudflare Pages build this site without needing my GCP credentials.