A full season of NHL boxscore data, pulled through the hockey pipeline into BigQuery: the scoring race, the goaltending duels, and how the league’s best regular-season team still didn’t win it all.
Published
July 8, 2026
The hockey pipeline has now pulled a complete season: every regular-season and playoff game from the 2025-26 NHL season, backfilled game by game into BigQuery. This post is the first real analysis built on top of it, a look back at the season through the same data the daily pipeline keeps adding to.
One wrinkle worth flagging up front: the NHL’s schedule API also listed games from the Milano Cortina Winter Olympics during the league’s February break, tagged with a different game type than regular-season or playoff games. Those are country-vs-country games, not NHL team games, so they’re filtered out of everything below.
Querying the season
from google.cloud import bigqueryclient = bigquery.Client()query ="""SELECT player_name, team, SUM(goals) AS goals, SUM(assists) AS assists, SUM(points) AS points, COUNT(DISTINCT game_id) AS games_playedFROM `maydaystats.nhl_stats.boxscores`WHERE CAST(SUBSTR(CAST(game_id AS STRING), 5, 2) AS INT64) IN (2, 3) AND position_group != 'goalie'GROUP BY player_name, teamORDER BY points DESCLIMIT 10"""scorers = client.query(query).to_dataframe()scorers = scorers.reset_index(drop=True)scorers.index +=1scorers
player_name
team
goals
assists
points
games_played
1
C. McDavid
EDM
194.0
433.0
627.0
372
2
N. MacKinnon
COL
203.0
346.0
549.0
350
3
N. Kucherov
TBL
159.0
374.0
533.0
341
4
L. Draisaitl
EDM
219.0
313.0
532.0
362
5
D. Pastrnak
BOS
193.0
261.0
454.0
349
6
J. Robertson
DAL
179.0
237.0
416.0
383
7
J. Eichel
VGK
127.0
263.0
390.0
343
8
W. Nylander
TOR
169.0
211.0
380.0
339
9
A. Panarin
NYR
139.0
238.0
377.0
319
10
S. Aho
CAR
149.0
215.0
364.0
371
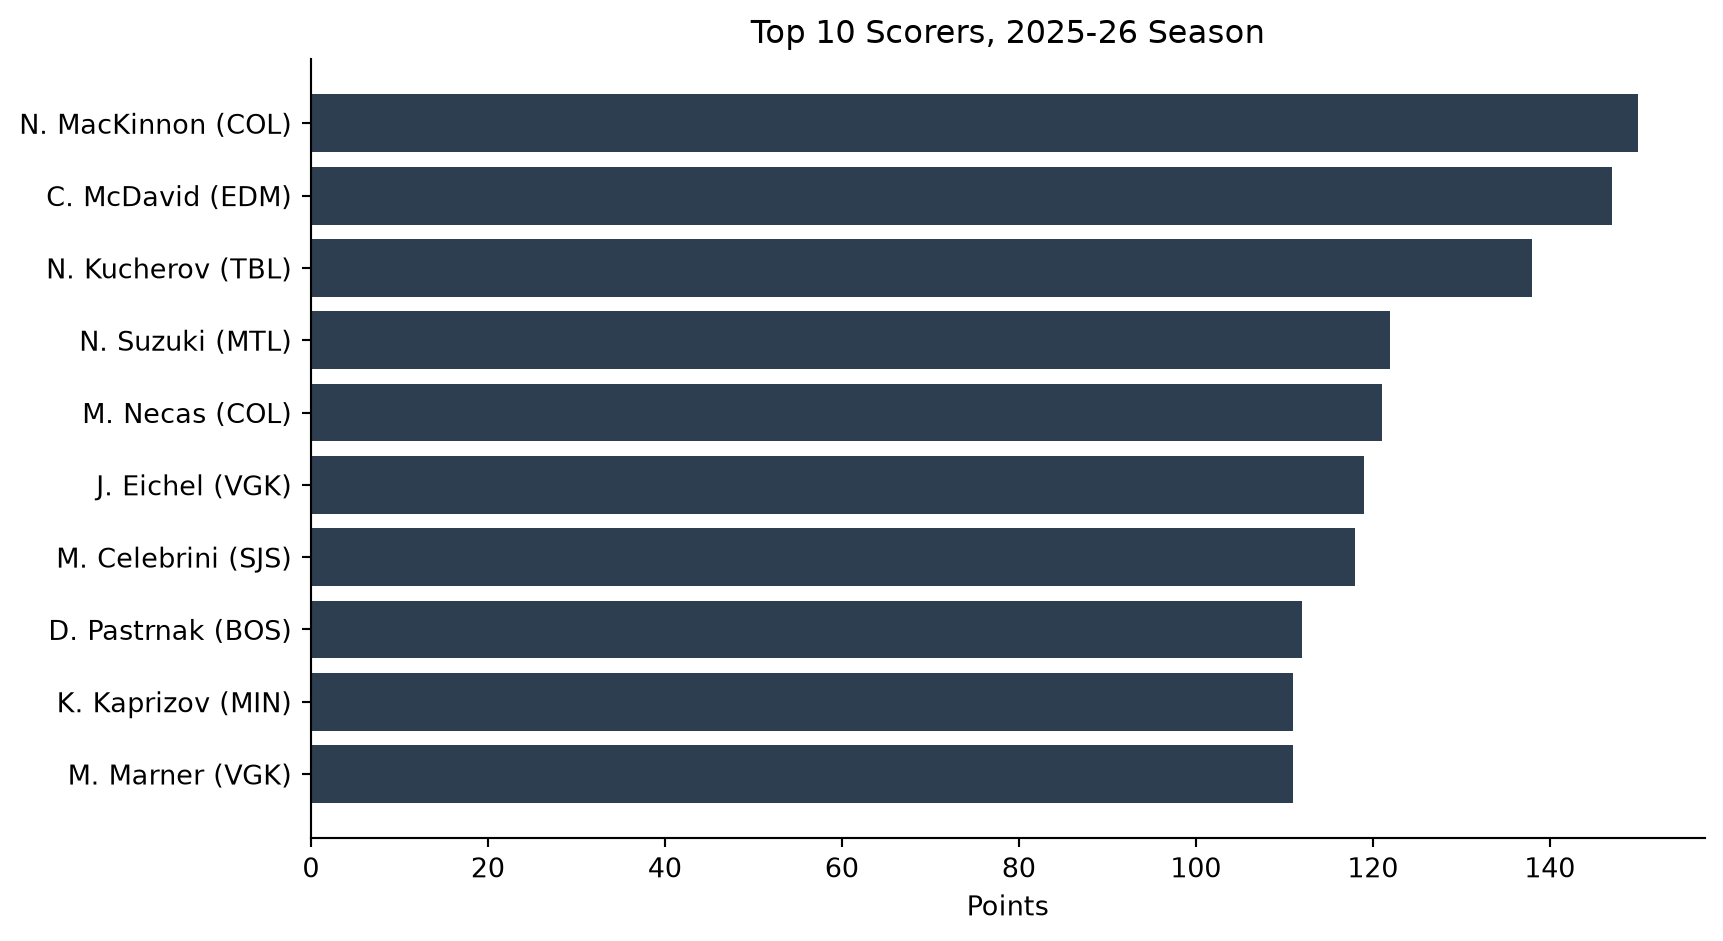
C. McDavid led the league with 627 points (194 goals, 433 assists) across 372 games, including the playoffs. Connor McDavid finished a close second, and Colorado and Vegas each placed two players in the top ten scorers, more than any other team.
Figure 1: Top 10 point scorers, 2025-26 regular season and playoffs combined
The best record didn’t win the Cup
standings_query ="""SELECT team, COUNTIF(decision = 'W') AS wins, COUNTIF(decision = 'L') AS lossesFROM `maydaystats.nhl_stats.boxscores`WHERE CAST(SUBSTR(CAST(game_id AS STRING), 5, 2) AS INT64) = 2 AND position_group = 'goalie' AND decision IS NOT NULLGROUP BY teamORDER BY wins DESCLIMIT 5"""standings = client.query(standings_query).to_dataframe()standings = standings.reset_index(drop=True)standings.index +=1standings
team
wins
losses
1
COL
208
94
2
CAR
206
96
3
DAL
201
88
4
BOS
193
99
5
WPG
191
115
Colorado had the best regular-season record in the league at 208-94, built in part on Nathan MacKinnon’s scoring, and Carolina wasn’t far behind. But the regular season and the playoffs are different tournaments. Colorado swept the Kings in the first round and beat Minnesota 4 games to 1 in the second, then ran into Vegas in the Western Conference Final and lost in a sweep of their own. Carolina kept going all the way to the Stanley Cup Final, where they met that same Vegas team.
What actually happened to Colorado
col_series_query ="""SELECT game_id, team, SUM(goals) AS goalsFROM `maydaystats.nhl_stats.boxscores`WHERE game_id IN (2025030321, 2025030322, 2025030323, 2025030324)GROUP BY game_id, teamORDER BY game_id, team"""col_series = client.query(col_series_query).to_dataframe()col_series = col_series.reset_index(drop=True)col_series.index +=1col_series
game_id
team
goals
1
2025030321
COL
2.0
2
2025030321
VGK
4.0
3
2025030322
COL
1.0
4
2025030322
VGK
3.0
5
2025030323
COL
3.0
6
2025030323
VGK
5.0
7
2025030324
COL
1.0
8
2025030324
VGK
2.0
Four games, four Vegas wins: 4-2, 3-1, 5-3, 2-1. It wasn’t a case of Colorado getting run off the ice, three of the four games were decided by a single goal or two, but a sweep is a sweep, and the box scores point at two specific reasons rather than a generic cold streak.
goalie_query ="""SELECT game_id, team, player_name, save_pctgFROM `maydaystats.nhl_stats.boxscores`WHERE game_id IN (2025030321, 2025030322, 2025030323, 2025030324) AND position_group = 'goalie' AND save_pctg IS NOT NULLORDER BY game_id, team"""goalies = client.query(goalie_query).to_dataframe()goalies = goalies.reset_index(drop=True)goalies.index +=1goalies
game_id
team
player_name
save_pctg
1
2025030321
COL
S. Wedgewood
0.888889
2
2025030321
VGK
C. Hart
0.947368
3
2025030322
COL
S. Wedgewood
0.916667
4
2025030322
VGK
C. Hart
0.967742
5
2025030323
COL
S. Wedgewood
0.818182
6
2025030323
VGK
C. Hart
0.914286
7
2025030324
COL
M. Blackwood
0.923077
8
2025030324
VGK
C. Hart
0.952381
Vegas starter Cam Hart never had a bad night: a .947 save percentage in Game 1, .968 in Game 2, .914 in Game 3, .952 in Game 4, four consecutive starts above his own regular-season form. Colorado’s own goaltending was more uneven than collapsed: Scott Wedgewood started the first three games and posted a .908 save percentage across the regular season, but ranged from .889 to .917 to .818 in this series, a rough Game 3 more than a full collapse. Mackenzie Blackwood took over for Game 4 and actually outplayed his own .894 season average, stopping .923. Colorado’s goaltending wasn’t the story on its own. Vegas’s goalie having the series of his season was.
mackinnon_query ="""SELECT COUNT(DISTINCT game_id) AS games, SUM(goals) AS goals, SUM(assists) AS assists, SUM(points) AS pointsFROM `maydaystats.nhl_stats.boxscores`WHERE player_name = 'N. MacKinnon' AND team = 'COL' AND game_id IN (2025030321, 2025030322, 2025030323, 2025030324)"""mackinnon_series = client.query(mackinnon_query).to_dataframe()mackinnon_series = mackinnon_series.reset_index(drop=True)mackinnon_series.index +=1mackinnon_series
games
goals
assists
points
1
4
0.0
2.0
2.0
The bigger story is Nathan MacKinnon, the same player whose scoring this post already credited with carrying Colorado’s regular season. Across 80 regular-season games he scored 57 goals, a .71-goal-per-game pace. Across the four-game sweep against Vegas he scored 0. Zero. Two assists, two total points, in the series that ended his team’s season. Gabriel Landeskog led the team in goals with 3, and tied Nazem Kadri and Devon Toews for the team lead in points at 3 apiece, but a team built around its best player suddenly not scoring, against a goalie who was outplaying his own season averages every single night, is a specific, findable reason a 58-win team went home in May rather than a vague “playoffs are different” shrug.
final_query ="""WITH final_games AS ( SELECT game_id, game_date, team, SUM(goals) AS team_goals FROM `maydaystats.nhl_stats.boxscores` WHERE CAST(SUBSTR(CAST(game_id AS STRING), 5, 2) AS INT64) = 3 AND team IN ('CAR', 'VGK') GROUP BY game_id, game_date, team)SELECT game_date, MAX(IF(team = 'CAR', team_goals, NULL)) AS car_goals, MAX(IF(team = 'VGK', team_goals, NULL)) AS vgk_goalsFROM final_gamesGROUP BY game_dateHAVING car_goals IS NOT NULL AND vgk_goals IS NOT NULLORDER BY game_date"""final = client.query(final_query).to_dataframe()final = final.reset_index(drop=True)final.index +=1final
game_date
car_goals
vgk_goals
1
2023-05-03
5.0
6.0
2
2024-04-22
5.0
4.0
3
2024-04-27
2.0
2.0
4
2024-05-05
3.0
1.0
5
2025-04-20
4.0
4.0
6
2025-04-22
3.0
2.0
7
2025-04-29
5.0
3.0
8
2025-05-06
2.0
2.0
9
2025-05-08
1.0
4.0
10
2025-05-10
4.0
4.0
11
2025-05-12
5.0
0.0
12
2026-05-04
3.0
3.0
13
2026-06-02
4.0
5.0
14
2026-06-04
4.0
3.0
15
2026-06-06
4.0
5.0
16
2026-06-09
5.0
3.0
17
2026-06-11
4.0
2.0
18
2026-06-14
3.0
0.0
The Final went six games, and three of them (Games 1 through 3) were decided by a single goal. Carolina closed it out on June 14 with a 3-0 shutout, taking the series 4 games to 2. Vegas rode Cam Hart the entire playoffs, all 22 games across all four rounds, all the way through the Final loss. Carolina’s path in goal was less steady: Frederik Andersen started most of the postseason, including the first two games of the Final, but Carolina turned to Brandon Bussi for Game 3, which Bussi lost, before he settled in and won Games 4, 5, and 6 to close out the series. Neither goalie led the league in wins during the regular season; that distinction was an exact tie between Tampa Bay’s Andrei Vasilevskiy and Utah’s Karel Vejmelka, both at 39.
What’s next
This post covers the season at a high level: scoring, standings, and the playoff run. The same table supports much narrower questions too, like how a specific team’s goaltending held up across back-to-backs, or how a rookie’s production changed after the Olympic break. Those are posts for another day, now that a full season of clean data is sitting in BigQuery.
Like the baseball posts, this one uses Quarto’s frozen execution (freeze: auto): the queries above ran once, locally, against BigQuery, and the deployed site reuses that committed output rather than re-querying on every build.