What the Data Actually Says About Nashville’s Offseason
Hockey
Four seasons of league-wide boxscore data, used to check what each of Nashville’s new additions has actually produced rather than guess at what they’ll do next.
Published
July 28, 2026
The Predators are my favorite team, so this one’s personal, but the goal here is the same as every other post on this site: let the data drive the conversation, not a hunch. Nashville had a rough 2024-25 (more on that below), which is the backdrop for a genuinely busy offseason: trades for Mavrik Bourque, Ilya Lyubushkin, Jack Drury, Ross Colton, Nils Hoglander, and Adam Edstrom, plus free agent signings Alexander Kerfoot, Jack Ahcan, and Hunter Skinner.
Until recently, our hockey pipeline only held a single season of league-wide data, enough to look back at last year but not enough to tell a real trend from a one-year blip. We backfilled three additional seasons (2022-23 through 2024-25) specifically to check that before writing anything about these additions. What follows is what each of them has actually done over the last four years, not a projection of how Nashville’s 2026-27 season goes; that’s a different question, and one this post isn’t trying to answer.
Where the roster turnover came from
from google.cloud import bigqueryclient = bigquery.Client()record_query ="""WITH tagged AS ( SELECT game_id, game_date, team, decision, position_group, CASE WHEN game_date BETWEEN '2022-10-01' AND '2023-06-30' THEN '2022-23' WHEN game_date BETWEEN '2023-10-01' AND '2024-06-30' THEN '2023-24' WHEN game_date BETWEEN '2024-10-01' AND '2025-06-30' THEN '2024-25' WHEN game_date BETWEEN '2025-10-01' AND '2026-06-30' THEN '2025-26' END AS season, CAST(SUBSTR(CAST(game_id AS STRING), 5, 2) AS INT64) AS game_type FROM `maydaystats.nhl_stats.boxscores` WHERE team IN ('NSH', 'COL'))SELECT team, season, COUNTIF(decision = 'W') AS wins, COUNTIF(decision = 'L') AS lossesFROM taggedWHERE season IS NOT NULL AND game_type = 2 AND position_group = 'goalie' AND decision IS NOT NULLGROUP BY team, seasonORDER BY team, season"""nsh_col_record = client.query(record_query).to_dataframe()nsh_col_record_tbl = nsh_col_record.reset_index(drop=True)nsh_col_record_tbl.index +=1nsh_col_record_tbl
team
season
wins
losses
1
COL
2022-23
51
24
2
COL
2023-24
50
25
3
COL
2024-25
49
29
4
COL
2025-26
58
16
5
NSH
2022-23
42
32
6
NSH
2023-24
47
30
7
NSH
2024-25
30
44
8
NSH
2025-26
40
34
Nashville went 42-32 and 47-30 the two seasons before last, then fell to 30-44 in 2024-25, before a partial recovery to 40-34 last season, still outside a playoff spot. That’s the record Chris MacFarland inherited when he was hired as President of Hockey Operations and General Manager on June 2, 2026, replacing Barry Trotz.
Every trade and signing covered in this post is MacFarland’s, made within his first six weeks in the job. That doesn’t mean he’s an unknown quantity, though: he spent the previous four seasons as general manager of the Colorado Avalanche, the same four seasons in our data above, and the table shows exactly why he was a sought-after hire. Colorado won 51, 50, and 49 games the first three of those seasons, then 58 last year on the way to the Presidents’ Trophy. Three of Nashville’s new additions, Jack Drury, Ross Colton, and Jack Ahcan, played for Colorado under MacFarland before he brought them with him, which changes how to read their sections below: this isn’t a GM betting on strangers, it’s a GM going back to players whose performance under his own front office he already has years of data on.
The additions, by the numbers
import pandas as pdadditions_query ="""WITH tagged AS ( SELECT *, CASE WHEN game_date BETWEEN '2022-10-01' AND '2023-06-30' THEN '2022-23' WHEN game_date BETWEEN '2023-10-01' AND '2024-06-30' THEN '2023-24' WHEN game_date BETWEEN '2024-10-01' AND '2025-06-30' THEN '2024-25' WHEN game_date BETWEEN '2025-10-01' AND '2026-06-30' THEN '2025-26' END AS season, CAST(SUBSTR(CAST(game_id AS STRING), 5, 2) AS INT64) AS game_type, CAST(SPLIT(toi, ':')[OFFSET(0)] AS FLOAT64) + CAST(SPLIT(toi, ':')[OFFSET(1)] AS FLOAT64)/60 AS toi_min FROM `maydaystats.nhl_stats.boxscores` WHERE player_name IN ( 'M. Bourque', 'I. Lyubushkin', 'J. Drury', 'R. Colton', 'N. Hoglander', 'A. Edstrom', 'A. Kerfoot', 'J. Ahcan', 'H. Skinner' ) AND position_group != 'goalie')SELECT player_name, season, STRING_AGG(DISTINCT team, '/') AS team, COUNT(DISTINCT game_id) AS games, SUM(goals) AS goals, SUM(assists) AS assists, SUM(points) AS points, ROUND(SAFE_DIVIDE(SUM(points), COUNT(DISTINCT game_id)), 2) AS pts_per_gp, SUM(shots_on_goal) AS shots, SUM(hits) AS hits, SUM(blocked_shots) AS blocked, ROUND(AVG(toi_min), 2) AS avg_toiFROM taggedWHERE season IS NOT NULL AND game_type IN (2, 3)GROUP BY player_name, seasonORDER BY player_name, season"""additions = client.query(additions_query).to_dataframe()TEAM_NAMES = {"DAL": "Dallas Stars", "COL": "Colorado Avalanche", "VAN": "Vancouver Canucks","BUF": "Buffalo Sabres", "TOR": "Toronto Maple Leafs", "ANA": "Anaheim Ducks","ARI": "Arizona Coyotes", "UTA": "Utah Hockey Club/Mammoth", "CAR": "Carolina Hurricanes","TBL": "Tampa Bay Lightning", "STL": "St. Louis Blues", "NYR": "New York Rangers","NSH": "Nashville Predators",}
Every table in the sections below is pulled from this same four-season dataset, filtered to that one player. All games played column figures are regular season plus playoffs combined; “avg_toi” is average time on ice per game, in minutes.
Mavrik Bourque: a two-year breakout, not a one-year spike
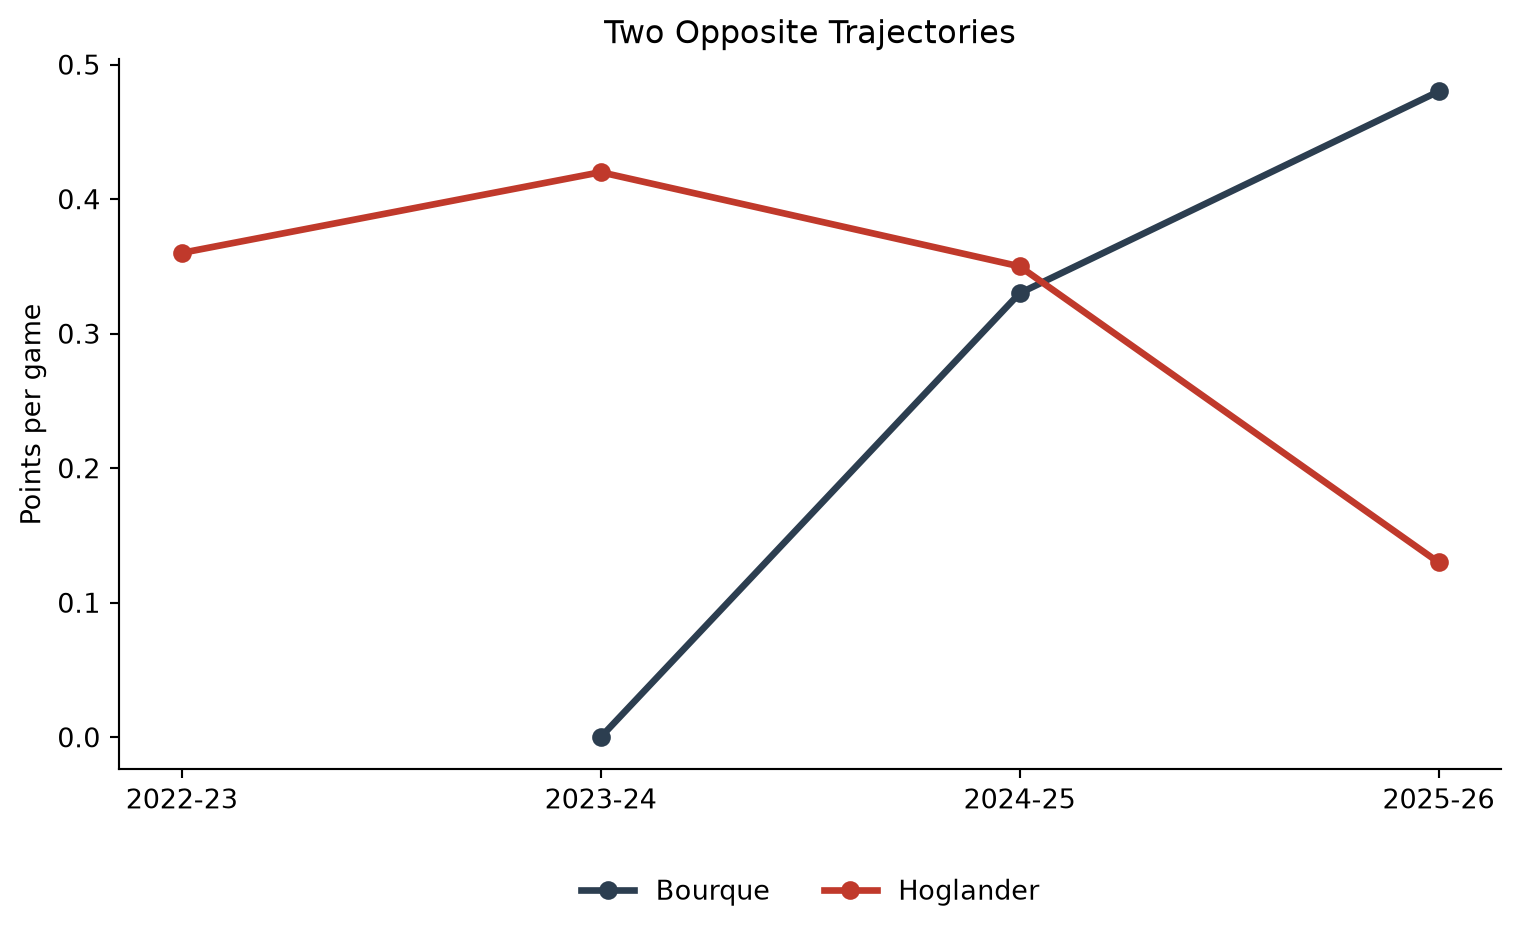
Bourque barely played in his first two seasons with Dallas, then put together two real, progressively better years: 25 points in 76 games (.33 points per game) in 2024-25, then 42 points in 88 games (.48 points per game) last season, a career high. His average ice time climbed right alongside it, from 12.6 to 15.5 minutes a night. That’s usage and production rising together across two separate seasons, not one good stretch. It’s also why Dallas moved to re-sign him the same day it traded him away, and why Nashville followed with a six-year, $33 million extension almost immediately after.
Hoglander is Bourque’s mirror image. He broke out with Vancouver in 2023-24 (38 points in 91 games, .42 per game), then both his production rate and his games played have fallen every season since: .35 points per game in 2024-25, then just .13 points per game across only 38 games last season, his worst rate anywhere in this four-year window, including a shortened 2022-23. Nothing in this dataset explains why; injury and role changes both look plausible, and we don’t have the data to say which. But the direction itself, happening right in his walk year before a trade, is worth flagging plainly rather than assuming last year was a fluke.
Two opposite trajectories, side by side
Put the two players’ four-year lines on the same chart and the contrast is hard to miss: one arrow pointing up, one pointing down, right as both of them join the same team.
import matplotlib.pyplot as plt# Bourque has no regular-season or playoff games in 2022-23 (just a few# preseason appearances, filtered out above), so his line is missing that# season while Hoglander's isn't. Reindexing both to the same full season# list, rather than plotting each dataframe's own "season" column directly,# keeps the x-axis in chronological order instead of matplotlib appending# whichever season it encounters first as a new category, which is what# was pushing 2022-23 to the wrong end of the chart.ALL_SEASONS = ["2022-23", "2023-24", "2024-25", "2025-26"]bourque_by_season = bourque.set_index("season")["pts_per_gp"].reindex(ALL_SEASONS)hoglander_by_season = hoglander.set_index("season")["pts_per_gp"].reindex(ALL_SEASONS)fig, ax = plt.subplots(figsize=(8, 5))ax.plot(ALL_SEASONS, bourque_by_season, marker="o", linewidth=2.5, color="#2c3e50", label="Bourque")ax.plot(ALL_SEASONS, hoglander_by_season, marker="o", linewidth=2.5, color="#c0392b", label="Hoglander")ax.set_ylabel("Points per game")ax.set_title("Two Opposite Trajectories")ax.spines[["top", "right"]].set_visible(False)ax.legend(loc="upper center", bbox_to_anchor=(0.5, -0.12), ncol=2, frameon=False)plt.tight_layout()plt.show()
Figure 1: Points per game by season: Bourque’s rise vs. Hoglander’s decline
Neither line guarantees what happens next in Nashville, but heading into the same season, one of these two is trending toward more opportunity and one is trending toward less.
Jack Drury: a trade adjustment he’s already lived through once
Drury already has a data point for exactly the situation he’s about to go through again. His rate production dipped the season he was traded from Carolina to Colorado, 2024-25 (.25 points per game, down from .38 the year before), then recovered to a new career high in ice time (13.9 minutes a night) once he settled in with Colorado last season, under MacFarland. A mid-career trade denting his numbers for a season before a rebound isn’t a guarantee it happens the same way twice, but it’s a real, observed precedent for what an adjustment period might look like for him specifically, and it’s worth noting the GM who watched that rebound happen up close is the same one bringing him to Nashville.
Colton is the lowest-variance player in this group: between 29 and 44 points every season across two different rosters (Tampa Bay, then Colorado, where he’s played for MacFarland since the 2023-24 trade), and consistently among the heaviest hitters in the entire sample, 148 to 207 hits a year. Whatever role he’s handed in Nashville, the four-year track record, three of those years under the GM who just signed him, says both the scoring floor and the physical identity travel with him.
Ilya Lyubushkin: minutes and physicality, not scoring
Lyubushkin’s point totals, 11 to 17 a season, are close to noise for a full-time NHL defenseman. What isn’t noise is his usage: 15 to 17-plus minutes a night in every one of the last four seasons, with some of the heaviest hits-plus-blocks totals of anyone in this group, including a career-high 205 hits in 2023-24, the same season he was traded mid-year from Anaheim to Toronto. He was brought in to defend, not to add offense, and the numbers back that up every single year.
Alexander Kerfoot: reliable across three team identities
Table 6: Alexander Kerfoot, 2022-23 through 2025-26
season
team
games
points
pts_per_gp
avg_toi
1
2022-23
TOR
93
34.0
0.37
14.57
2
2023-24
ARI
82
45.0
0.55
17.43
3
2024-25
UTA
81
28.0
0.35
15.25
4
2025-26
UTA
40
14.0
0.35
13.42
Kerfoot has posted between .35 and .55 points per game in every one of the last four seasons, across two different organizations, one of which changed its own name twice in that span (Arizona Coyotes became the Utah Hockey Club in 2024-25, then the Utah Mammoth last season). Middle-six production that holds up regardless of the roster around it is exactly what a two-year, $7 million free agent deal is supposed to buy.
Adam Edstrom: energy-line depth, not a scoring addition
Edstrom’s ice time, 8 to 9.5 minutes a night every season he’s played, is the lowest of any forward in this group, and his points total tracks with it. That profile, heavy on shifts, light on minutes, is a bottom-six energy role, not a scoring addition, and nothing here suggests Nashville is expecting otherwise.
Jack Ahcan and Hunter Skinner: too little NHL sample to say anything
Table 8: Jack Ahcan and Hunter Skinner, every NHL game either has played, 2022-23 through 2025-26
player_name
season
team
games
points
1
H. Skinner
2025-26
STL
1
0.0
2
J. Ahcan
2024-25
COL
2
0.0
3
J. Ahcan
2025-26
COL
14
2.0
Both of these signings genuinely don’t have enough played games to analyze the way the seven players above do. Ahcan has appeared in 16 total NHL games across all four seasons in our data, all of them with Colorado; Skinner has appeared in one. That’s the entire table above, not a partial view of it. That’s not a data gap on our end, it’s an accurate reflection of two-way contracts for players who’ve spent most of the last four years in the minors. Even Ahcan’s tie to MacFarland’s Colorado roster doesn’t change that; 16 games is still 16 games. Grouping them here instead of forcing a trend out of a handful of games is the honest version of covering them.
What this actually adds up to
Four years of real data points to a roster that added one legitimate growth story (Bourque), one clear risk worth watching (Hoglander), one player with a specific, already-lived precedent for a trade adjustment (Drury), two proven physical, low-variance role players (Colton, Lyubushkin), one reliable if unspectacular scorer (Kerfoot), one honest depth piece (Edstrom), and two players who are still too much of an unknown to say anything about. Three of those names, Drury, Colton, and Ahcan, aren’t strangers to the new front office either; their track records are also a track record of playing for MacFarland himself. None of that adds up to a predicted record or a playoff projection for 2026-27; that would take more than four years of individual track records, it would take assumptions about health, chemistry, and a full season that hasn’t been played yet. What the data can say, honestly, is what each of these players, and the GM who brought several of them along with him, has actually done before this summer in Nashville.
Note
This post uses Quarto’s frozen execution (freeze: auto): the numbers above reflect the nhl_stats.boxscores data as of whenever this was last rendered locally, not a live query on every page load. The 2022-23 through 2024-25 seasons were backfilled specifically for this post; the 2025-26 season was already in place from the hockey year-in-review post.