Year in Review: The 2025-26 NCAA Men’s Volleyball Season
Volleyball
A full spring season of NCAA men’s volleyball boxscore data, pulled through the self-hosted NCAA pipeline into BigQuery: the kills leaders, and how Hawaii beat UC Irvine for the national title.
Published
July 8, 2026
The men’s volleyball pipeline has now pulled a complete season: every Division I match from January through the national championship in early May, backfilled game by game into BigQuery via the self-hosted NCAA API proxy. This post is the first real analysis built on top of it.
One note on the data: about 6% of rows carry a blank player name despite having real stat values, a gap on NCAA’s own side for a small number of games rather than a pipeline bug (see the pipeline’s DEPLOY.md for the full explanation). Everything below filters those rows out.
Querying the season
from google.cloud import bigqueryclient = bigquery.Client()# NCAA's API returns team as its own 6-character code (e.g. "PEPPER"), not# a school name. Tables and charts below keep the raw code as-is (matches# how the hockey post's chart also uses raw team codes); this mapping is# only used to spell out real school names in the prose. A code not in# this dict falls back to showing the raw abbreviation rather than# failing, in case a future re-render surfaces a school not covered yet.TEAM_NAMES = {"PEPPER": "Pepperdine","UC IRV": "UC Irvine","BALLST": "Ball State","CATAWB": "Catawba","PENNST": "Penn State","MCKEND": "McKendree","EMMAN": "Emmanuel (Ga.)","LEWIS": "Lewis","HAWAII": "Hawaii","UCLA": "UCLA","USC": "USC",}def team_name(code):return TEAM_NAMES.get(code, code)query ="""SELECT player_name, team, SUM(CAST(kills AS INT64)) AS kills, SUM(CAST(attack_attempts AS INT64)) AS attempts, SAFE_DIVIDE( SUM(CAST(kills AS INT64)) - SUM(CAST(attack_errors AS INT64)), SUM(CAST(attack_attempts AS INT64)) ) AS hitting_pct, COUNT(DISTINCT game_id) AS gamesFROM `maydaystats.ncaa_volleyball_men.boxscores`WHERE player_name != ''GROUP BY player_name, teamHAVING attempts >= 200ORDER BY kills DESCLIMIT 10"""leaders = client.query(query).to_dataframe()leaders = leaders.reset_index(drop=True)leaders.index +=1leaders
player_name
team
kills
attempts
hitting_pct
games
1
Cole Hartke
PEPPER
452
937
0.352188
29
2
Andrej Jokanovic
UC IRV
419
998
0.278557
30
3
Patrick Rogers
BALLST
414
786
0.399491
31
4
Justin Arrowood
CATAWB
397
938
0.210021
27
5
Sean Kelly
UCLA
396
753
0.398406
31
6
Sean Harvey
PENNST
388
806
0.328784
29
7
Zach Rama
UCLA
386
803
0.332503
30
8
Dillon Klein
USC
385
770
0.340260
27
9
Bryce Wetjen
MCKEND
375
813
0.258303
29
10
Aidan Feeney
EMMAN
374
880
0.244318
26
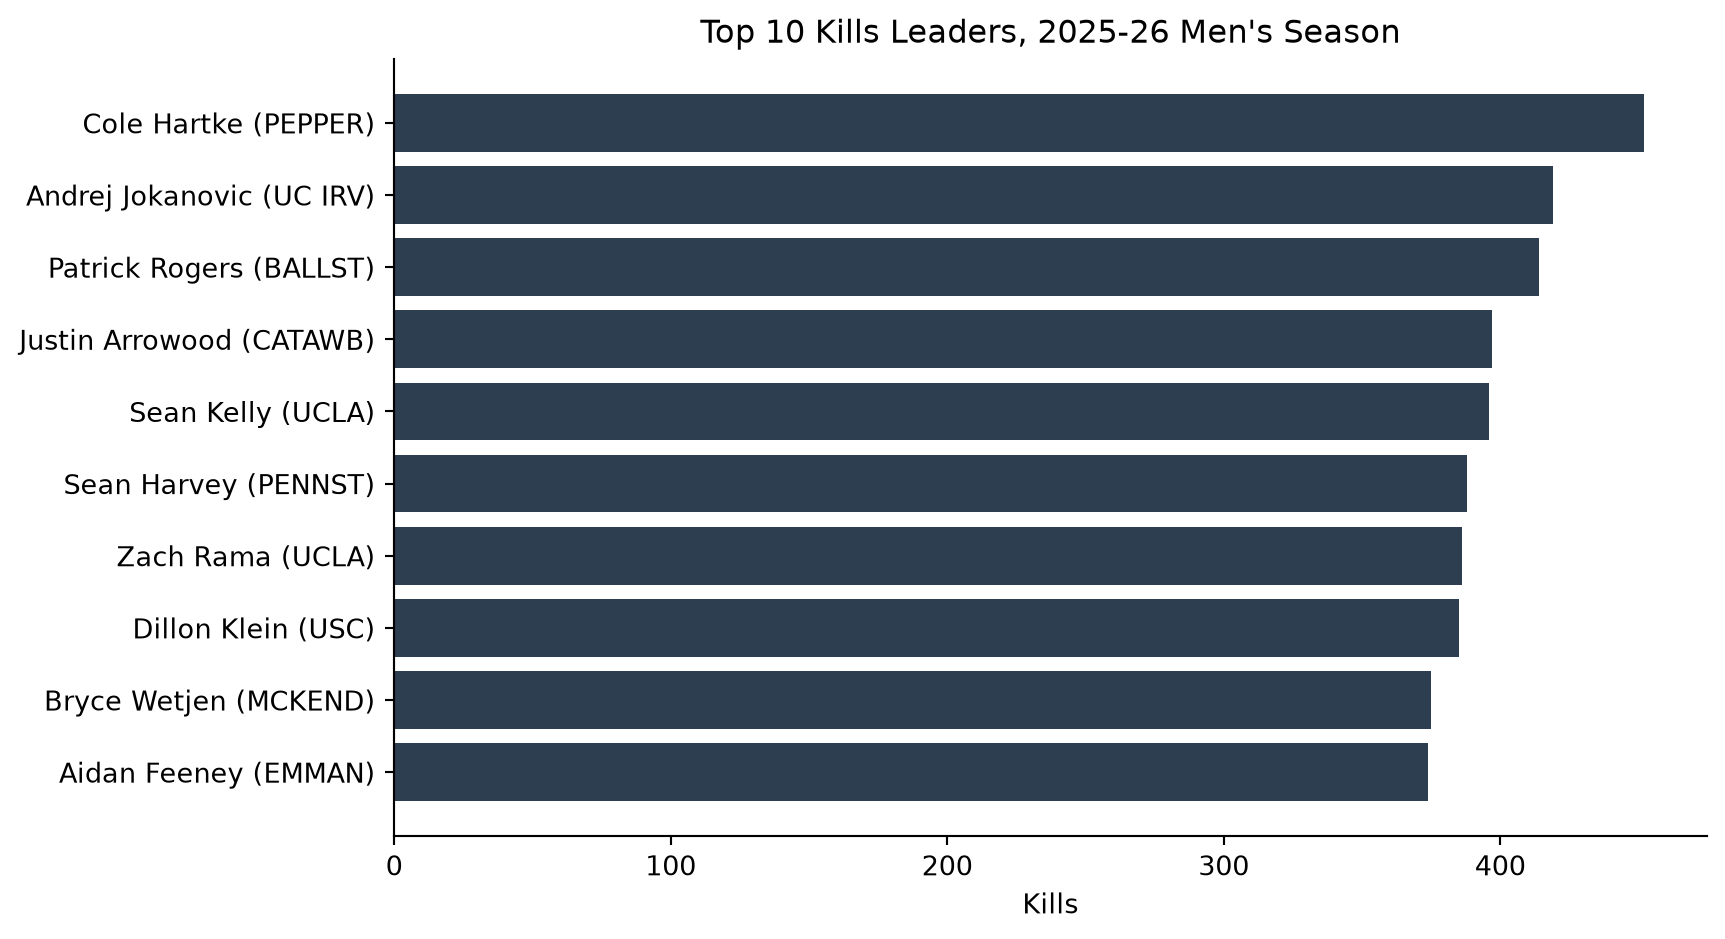
Cole Hartke of Pepperdine led the country with 452 kills, on a 0.352 hitting percentage across 29 matches. UC Irvine’s Andrej Jokanovic finished a close second in raw kills, but needed about 60 more swings to get there, a volume-over-efficiency trade that shows up again later in his team’s championship match.
Figure 1: Top 10 kills leaders, 2025-26 NCAA D1 men’s season (min. 200 attempts)
Digs, blocks, and aces
digs_query ="""SELECT player_name, team, SUM(CAST(digs AS INT64)) AS totalFROM `maydaystats.ncaa_volleyball_men.boxscores`WHERE player_name != ''GROUP BY player_name, teamORDER BY total DESCLIMIT 1"""digs_leader = client.query(digs_query).to_dataframe()blocks_query ="""SELECT player_name, team, SUM(CAST(total_blocks AS FLOAT64)) AS totalFROM `maydaystats.ncaa_volleyball_men.boxscores`WHERE player_name != ''GROUP BY player_name, teamORDER BY total DESCLIMIT 1"""blocks_leader = client.query(blocks_query).to_dataframe()aces_query ="""SELECT player_name, team, SUM(CAST(service_aces AS INT64)) AS totalFROM `maydaystats.ncaa_volleyball_men.boxscores`WHERE player_name != ''GROUP BY player_name, teamORDER BY total DESCLIMIT 1"""aces_leader = client.query(aces_query).to_dataframe()
Nico Paula (Lewis) led all players in digs with 264. Owen Rose (Penn State) topped the block chart with 156, well clear of the field. And Andrew Rowan (UCLA) led in aces with 57.
The championship: Hawaii over UC Irvine
final_query ="""SELECT player_name, team, kills, attack_attempts, hitting_percentage, total_blocksFROM `maydaystats.ncaa_volleyball_men.boxscores`WHERE game_id = '6598557' AND CAST(kills AS INT64) > 0ORDER BY team, CAST(kills AS INT64) DESC"""final_box = client.query(final_query).to_dataframe()final_box = final_box.reset_index(drop=True)final_box.index +=1final_box
player_name
team
kills
attack_attempts
hitting_percentage
total_blocks
1
Kristian Titriyski
HAWAII
16
31
0.387
1
2
Adrien Roure
HAWAII
15
31
0.323
0
3
Louis Sakanoko
HAWAII
12
20
0.500
3
4
Justin Todd
HAWAII
7
10
0.500
1
5
Trevell Jordan
HAWAII
5
7
0.714
3
6
Tread Rosenthal
HAWAII
3
6
0.167
3
7
Andrej Jokanovic
UC IRV
13
35
0.229
3
8
William D'arcy
UC IRV
9
24
0.292
0
9
Andreas Brinck
UC IRV
6
18
0.111
1
10
Trevor Clark
UC IRV
6
12
0.333
6
11
Micah Goss
UC IRV
3
4
0.750
6
12
Cameron Kosty
UC IRV
1
2
.000
5
Hawaii beat UC Irvine 3-1 on May 11, 2026 to win the national championship. Kristian Titriyski led the way with 16 kills on a .387 hitting percentage, with Adrien Roure adding 15 more. Louis Sakanoko went 12-for-20 (.500) with 3 blocks off the bench, the best hitting percentage of anyone with real volume in the match (two Hawaii players posted a higher percentage on much smaller sample sizes, 5-for-7 and 7-for-10).
UC Irvine’s offense leaned almost entirely on Andrej Jokanovic, the same volume hitter who finished second nationally in kills for the season. He had a team-high 13 kills in the final, but needed 35 attempts to get there, a .229 hitting percentage that never let UC Irvine pull away the way Hawaii’s more balanced, more efficient attack did.
What’s next
This covers the season at a high level: the national leaderboards and the championship match itself. The same table supports much narrower questions too, like a single team’s hitting efficiency by conference opponent, or how a freshman’s role grew over the season. Those are posts for another day, now that a full season of clean data is sitting in BigQuery.
Like the baseball and hockey posts, this one uses Quarto’s frozen execution (freeze: auto): the queries above ran once, locally, against BigQuery, and the deployed site reuses that committed output rather than re-querying on every build.