Year in Review: The 2025 NCAA Women’s Volleyball Season
Volleyball
A full fall season of NCAA women’s volleyball boxscore data, pulled through the self-hosted NCAA pipeline into BigQuery: Miami’s two-way offensive season, Utah Valley’s blocking wall, and how Texas A&M swept Kentucky for the national title.
Published
July 8, 2026
The women’s volleyball pipeline has now pulled a complete season: every Division I match from late August through the national championship in mid-December, backfilled game by game into BigQuery via the same self-hosted NCAA API proxy behind the men’s pipeline. This post is the first real analysis built on top of it.
One note on the data: a much smaller share of rows here (well under 1%) carry a blank player name, the same kind of NCAA-side gap described in the men’s year in review, not a pipeline bug.
Querying the season
from google.cloud import bigqueryclient = bigquery.Client()# NCAA's API returns team as its own code (e.g. "STFRPA"), not a school# name. Tables and charts below keep the raw code as-is (matches how the# hockey post's chart also uses raw team codes); this mapping is only# used to spell out real school names in the prose. A code not in this# dict falls back to showing the raw abbreviation rather than failing,# in case a future re-render surfaces a school not covered yet.TEAM_NAMES = {"MIAMI": "Miami","PITT": "Pittsburgh","PENNST": "Penn State","JMU": "James Madison","WISC": "Wisconsin","STFRPA": "Saint Francis (PA)","PURDUE": "Purdue","SAC ST": "Sacramento State","UK": "Kentucky","TCU": "TCU","UALR": "Little Rock","UT VAL": "Utah Valley","TX A&M": "Texas A&M",}def team_name(code):return TEAM_NAMES.get(code, code)query ="""SELECT player_name, team, SUM(CAST(kills AS INT64)) AS kills, SUM(CAST(attack_attempts AS INT64)) AS attempts, SAFE_DIVIDE( SUM(CAST(kills AS INT64)) - SUM(CAST(attack_errors AS INT64)), SUM(CAST(attack_attempts AS INT64)) ) AS hitting_pct, COUNT(DISTINCT game_id) AS gamesFROM `maydaystats.ncaa_volleyball_women.boxscores`WHERE player_name != ''GROUP BY player_name, teamHAVING attempts >= 200ORDER BY kills DESCLIMIT 10"""leaders = client.query(query).to_dataframe()leaders = leaders.reset_index(drop=True)leaders.index +=1leaders
player_name
team
kills
attempts
hitting_pct
games
1
Flormarie Heredia Colon
MIAMI
687
1447
0.289565
28
2
Olivia Babcock
PITT
646
1383
0.334056
35
3
Kennedy Martin
PENNST
634
1423
0.319044
31
4
Kennedy Louisell
JMU
605
1436
0.300836
31
5
Mimi Colyer
WISC
598
1313
0.340442
33
6
Korrin Burns
STFRPA
588
1335
0.268165
29
7
Kenna Wollard
PURDUE
577
1383
0.261750
34
8
Victoria Marthaler
SAC ST
553
1440
0.213194
30
9
Eva Hudson
UK
546
1376
0.319041
33
10
Evan Hendrix
TCU
543
1440
0.241667
32
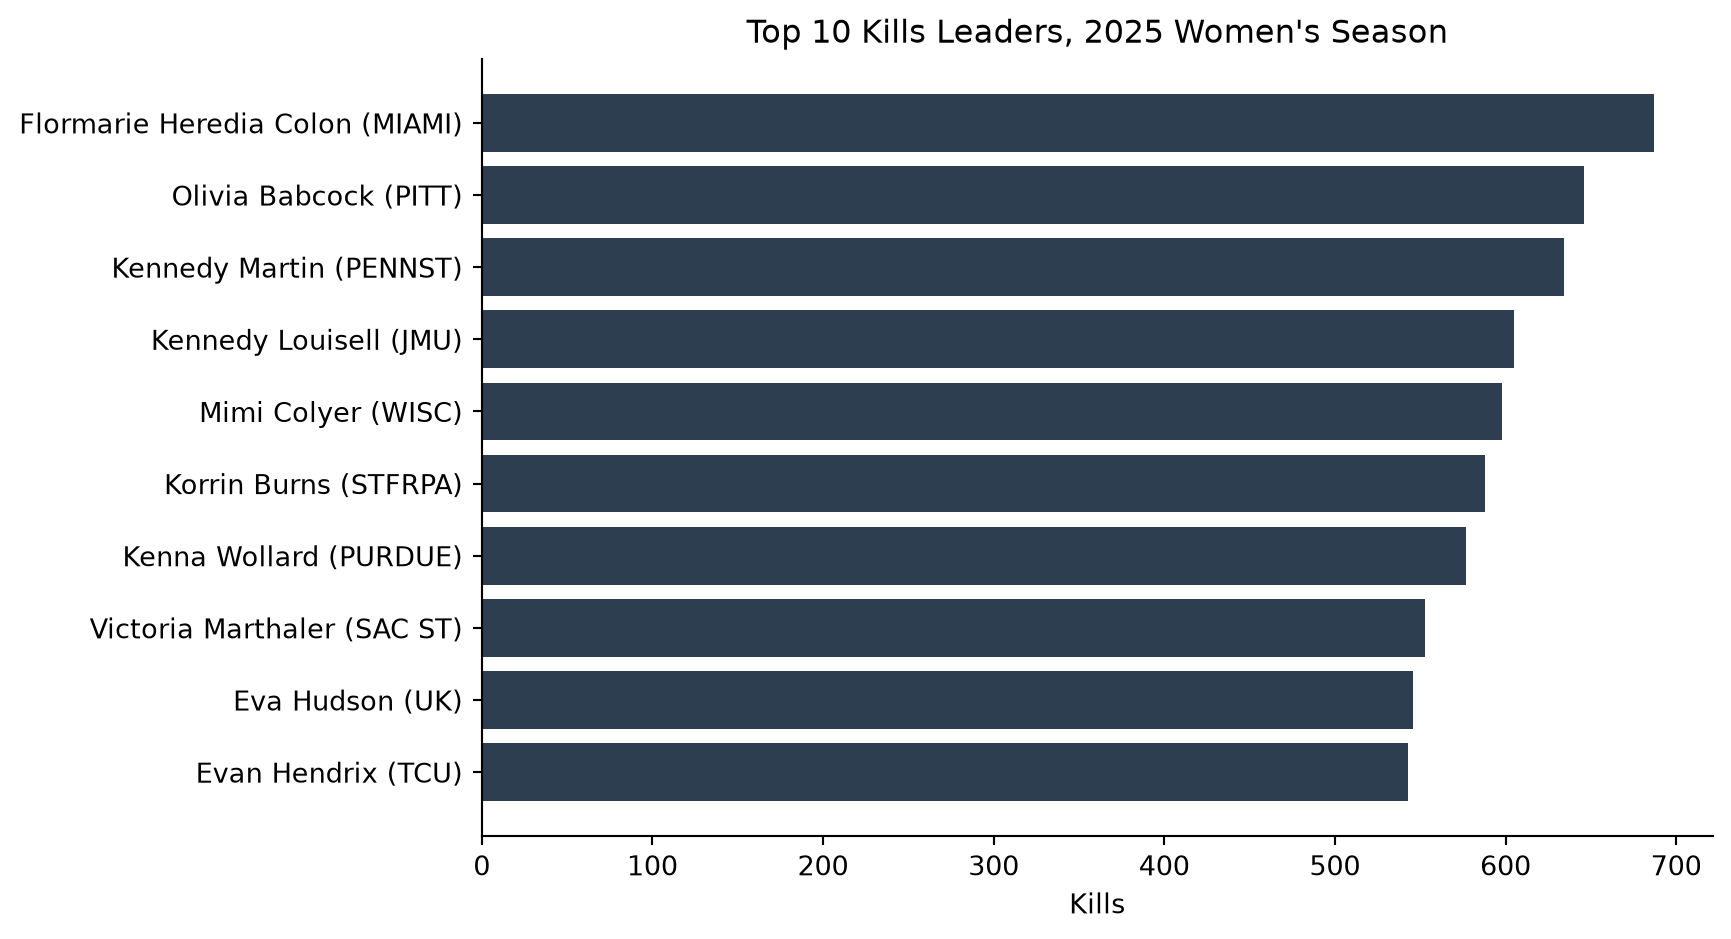
Flormarie Heredia Colon of Miami led the country with 687 kills across 28 matches. Miami shows up twice in the national leaderboards this season: the same team that produced the kills leader also produced the national leader in aces, a rare two-way offensive season for one program.
Figure 1: Top 10 kills leaders, 2025 NCAA D1 women’s season (min. 200 attempts)
Digs, blocks, and aces
digs_query ="""SELECT player_name, team, SUM(CAST(digs AS INT64)) AS totalFROM `maydaystats.ncaa_volleyball_women.boxscores`WHERE player_name != ''GROUP BY player_name, teamORDER BY total DESCLIMIT 1"""digs_leader = client.query(digs_query).to_dataframe()blocks_query ="""SELECT player_name, team, SUM(CAST(total_blocks AS FLOAT64)) AS totalFROM `maydaystats.ncaa_volleyball_women.boxscores`WHERE player_name != ''GROUP BY player_name, teamORDER BY total DESCLIMIT 1"""blocks_leader = client.query(blocks_query).to_dataframe()aces_query ="""SELECT player_name, team, SUM(CAST(service_aces AS INT64)) AS totalFROM `maydaystats.ncaa_volleyball_women.boxscores`WHERE player_name != ''GROUP BY player_name, teamORDER BY total DESCLIMIT 1"""aces_leader = client.query(aces_query).to_dataframe()
Andrea Roman (Little Rock) led all players in digs with 632. Bella Wooden of Utah Valley led the country in individual blocks with 188. And Ariana Rodriguez (Miami) topped the ace leaderboard with 77, the same program that produced the season’s kills leader.
The championship: Texas A&M sweeps Kentucky
final_query ="""SELECT player_name, team, kills, attack_attempts, hitting_percentage, digsFROM `maydaystats.ncaa_volleyball_women.boxscores`WHERE game_id = '6500718' AND CAST(kills AS INT64) > 0ORDER BY team, CAST(kills AS INT64) DESC"""final_box = client.query(final_query).to_dataframe()final_box = final_box.reset_index(drop=True)final_box.index +=1final_box
player_name
team
kills
attack_attempts
hitting_percentage
digs
1
Logan Lednicky
TX A&M
11
32
0.250
7
2
Kyndal Stowers
TX A&M
10
23
0.304
6
3
Ifenna Cos-Okpalla
TX A&M
8
17
0.235
0
4
Emily Hellmuth
TX A&M
6
18
0.167
3
5
Morgan Perkins
TX A&M
3
9
0.333
1
6
Maddie Waak
TX A&M
1
2
0.500
5
7
Eva Hudson
UK
13
45
0.200
4
8
Brooklyn DeLeye
UK
9
28
0.036
8
9
Asia Thigpen
UK
7
15
0.333
2
10
Lizzie Carr
UK
7
15
0.200
1
11
Kennedy Washington
UK
2
7
-0.286
1
12
Kassie O'Brien
UK
2
4
0.500
6
Texas A&M swept Kentucky 3-0 on December 21, 2025 to win the national championship. Logan Lednicky led the Aggies with 11 kills on a .250 hitting percentage, with Kyndal Stowers adding 10 more on .304 hitting, a balanced attack across multiple hitters rather than one player carrying the offense.
Kentucky’s Eva Hudson, who finished among the national top ten in kills for the season, led all players in the match with 13 kills, but needed 45 attempts to get there, a .200 hitting percentage. By far the highest attempt count on the floor, it meant Kentucky’s offense ran through one hitter without the efficiency to match the volume, the same volume-over- efficiency pattern that showed up in the men’s championship match.
What’s next
This covers the season at a high level: the national leaderboards and the championship match itself. The same table supports much narrower questions too, like how a team’s blocking efficiency changed after a lineup shift, or a transfer’s production before and after switching programs. Those are posts for another day, now that a full season of clean data is sitting in BigQuery.
Like the baseball, hockey, and men’s volleyball posts, this one uses Quarto’s frozen execution (freeze: auto): the queries above ran once, locally, against BigQuery, and the deployed site reuses that committed output rather than re-querying on every build.