A full season of Major League Volleyball box scores, scraped from PDF scoresheets and parsed into BigQuery: the league’s most productive hitter, and how the No. 2 seed knocked out an upset-minded No. 4 for the title.
Published
July 9, 2026
The MLV pipeline is the odd one out on this site: every other pipeline here reads a first-party JSON API directly, but MLV (provolleyball.com’s own Major League Volleyball) only publishes per-player box scores as PDF scoresheets attached to its schedule API. This pipeline downloads each match’s PDF, extracts the text, and parses it back into structured rows, working around two different scoresheet templates the league used across the season (see the pipeline’s DEPLOY.md for the full story). This post is the first analysis built on the result: every completed match from January through the May championship, backfilled into BigQuery.
One exclusion worth flagging up front: schedule_event 636 (Team Launiere vs. Team Meske, March 28) is an All-Star exhibition with draft-style team names, not a real matchup between league teams. It’s filtered out of every query below, the same way the hockey year in review filters out Olympic break games.
Querying the season
from google.cloud import bigqueryclient = bigquery.Client()query ="""SELECT player_name, team, SUM(points) AS points, SUM(kills) AS kills, SUM(attack_attempts) AS attempts, SAFE_DIVIDE(SUM(kills), SUM(attack_attempts)) AS kill_pct, COUNT(DISTINCT schedule_event_id) AS matchesFROM `maydaystats.mlv_volleyball.boxscores`WHERE team NOT IN ('Team Launiere', 'Team Meske')GROUP BY player_name, teamORDER BY points DESCLIMIT 10"""leaders = client.query(query).to_dataframe()leaders = leaders.reset_index(drop=True)leaders.index +=1leaders
player_name
team
points
kills
attempts
kill_pct
matches
1
Mimi Colyer
Dallas Pulse
516.0
455.0
1180.0
0.385593
28
2
Diaz Maldonado
Dallas Pulse
509.0
445.0
1113.0
0.399820
28
3
Raina Terry
Columbus Fury
398.0
344.0
1048.0
0.328244
24
4
Leah Edmond
Atlanta Vibe
387.0
338.0
984.0
0.343496
24
5
Grace Loberg
San Diego Mojo
361.0
301.0
998.0
0.301603
26
6
Paige Briggs-Romine
Grand Rapids Rise
351.0
315.0
931.0
0.338346
25
7
Carli Snyder
Grand Rapids Rise
334.0
293.0
956.0
0.306485
26
8
Brooke Nuneviller
Omaha Supernovas
325.0
306.0
950.0
0.322105
28
9
Azhani Tealer
Indy Ignite
319.0
287.0
634.0
0.452681
26
10
Aiko Jones
Atlanta Vibe
316.0
273.0
789.0
0.346008
24
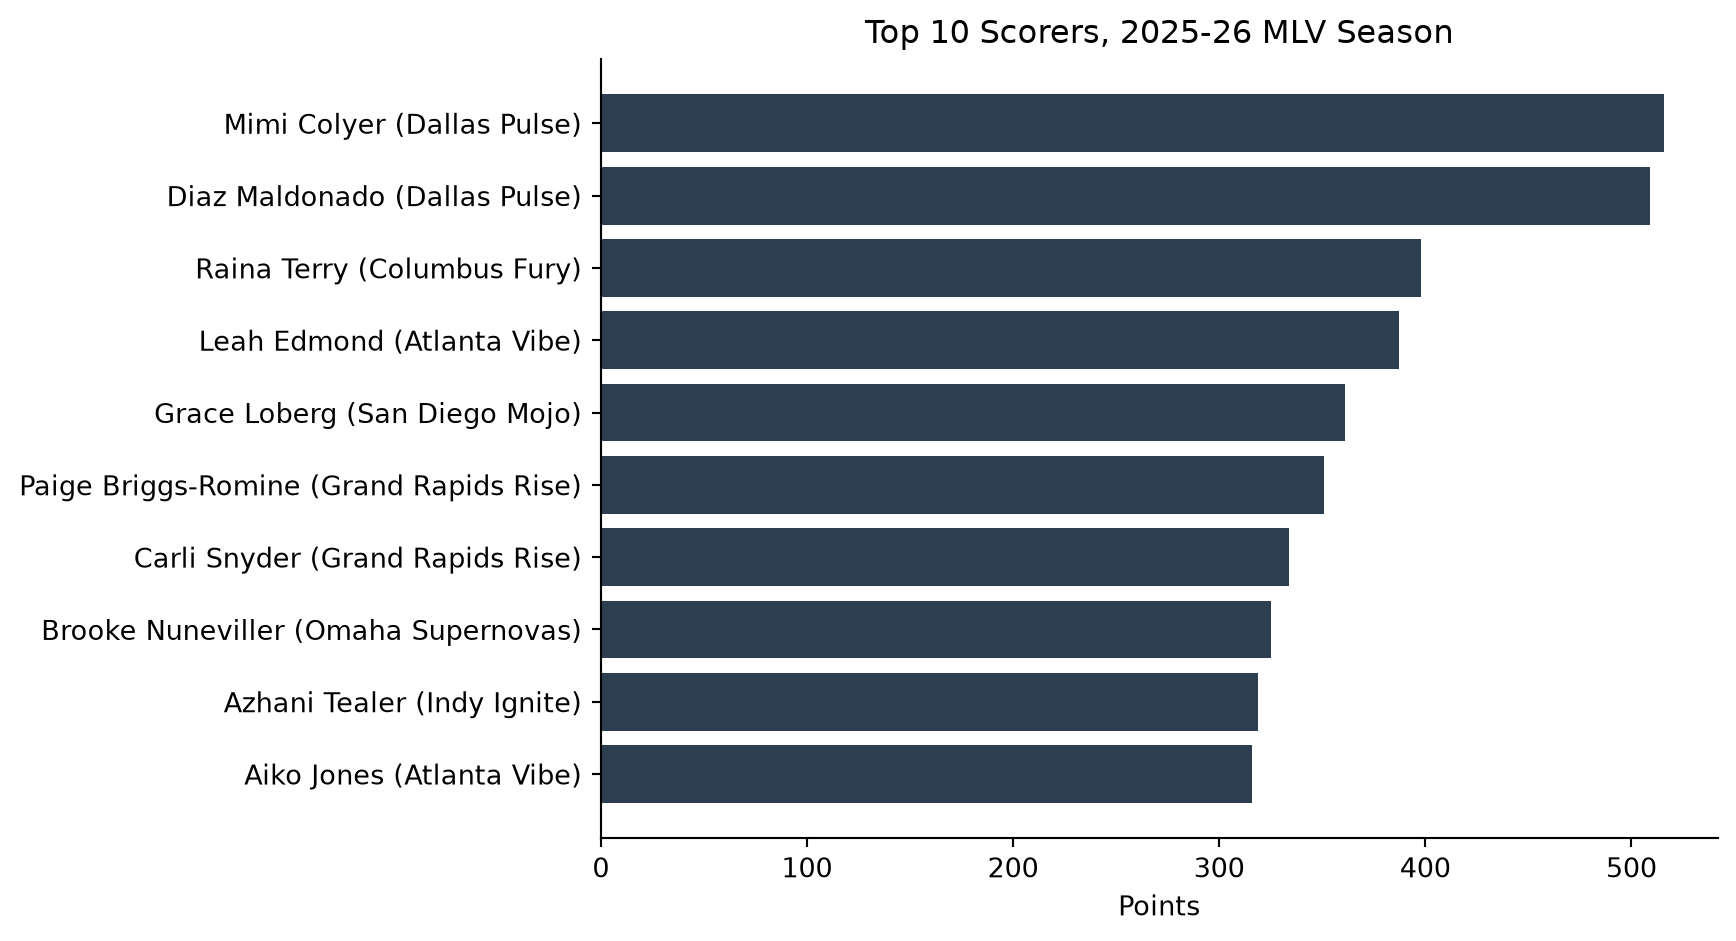
Mimi Colyer of Dallas Pulse led the league with 516 points on 455 kills across 28 matches. Her teammate Diaz Maldonado finished second, meaning the league’s two most productive hitters played for the same team all season, a preview of who’d end up cutting down the net in May.
Figure 1: Top 10 point scorers, 2025-26 MLV regular season and playoffs combined
Digs, aces, and assists
digs_query ="""SELECT player_name, team, SUM(digs) AS totalFROM `maydaystats.mlv_volleyball.boxscores`WHERE team NOT IN ('Team Launiere', 'Team Meske')GROUP BY player_name, teamORDER BY total DESCLIMIT 1"""digs_leader = client.query(digs_query).to_dataframe()assists_query ="""SELECT player_name, team, SUM(assists) AS totalFROM `maydaystats.mlv_volleyball.boxscores`WHERE team NOT IN ('Team Launiere', 'Team Meske')GROUP BY player_name, teamORDER BY total DESCLIMIT 1"""assists_leader = client.query(assists_query).to_dataframe()aces_query ="""SELECT player_name, team, SUM(service_aces) AS totalFROM `maydaystats.mlv_volleyball.boxscores`WHERE team NOT IN ('Team Launiere', 'Team Meske')GROUP BY player_name, teamORDER BY total DESCLIMIT 1"""aces_leader = client.query(aces_query).to_dataframe()
Shara Venegas (San Diego Mojo) led all players in digs with 320. Marlie Monserez (San Diego Mojo) ran the offense from the back row, topping the league with 1067 assists. And Natalie Foster (Orlando Valkyries) led in aces.
The best record didn’t win it either
standings_query ="""WITH regular_season AS ( SELECT * FROM `maydaystats.mlv_volleyball.matches` WHERE schedule_event_id NOT IN (637, 638, 639)),team_results AS ( SELECT first_team_name AS team, IF(first_team_score > second_team_score, 1, 0) AS win FROM regular_season UNION ALL SELECT second_team_name AS team, IF(second_team_score > first_team_score, 1, 0) AS win FROM regular_season)SELECT team, SUM(win) AS wins, COUNT(*) - SUM(win) AS lossesFROM team_resultsGROUP BY teamORDER BY wins DESCLIMIT 5"""standings = client.query(standings_query).to_dataframe()standings = standings.reset_index(drop=True)standings.index +=1standings
team
wins
losses
1
Indy Ignite
20
5
2
Dallas Pulse
18
8
3
San Diego Mojo
13
12
4
Omaha Supernovas
12
14
5
Grand Rapids Rise
11
15
Indy Ignite had the best regular-season record in the league at 20-5, good enough for the No. 1 seed in a four-team playoff. It didn’t matter: the No. 4 seed knocked them out in the semifinal, the same shape as this site’s NHL year in review, where Colorado had the league’s best regular season and still lost in the Western Conference Final. The best regular season and the tournament that actually decides the title are two different contests.
The playoffs
import replayoff_query ="""SELECT schedule_event_id, game_date, first_team_name, first_team_score, second_team_name, second_team_scoreFROM `maydaystats.mlv_volleyball.matches`WHERE schedule_event_id IN (637, 638, 639)ORDER BY game_date"""playoffs = client.query(playoff_query).to_dataframe()# Playoff schedule-events carry a seed prefix in the raw team name# ("No. 4 Omaha Supernovas") that the regular-season rows don't - strip# it for display, same cleanup the pipeline itself does before matching# team names against the PDF text (see fetch.py's _strip_seed).seed_re = re.compile(r"^No\.\s*\d+\s+")for col in ("first_team_name", "second_team_name"): playoffs[col] = playoffs[col].str.replace(seed_re, "", regex=True)playoffs = playoffs.reset_index(drop=True)playoffs.index +=1playoffs
schedule_event_id
game_date
first_team_name
first_team_score
second_team_name
second_team_score
1
637
2026-05-07T23:00:00.000000Z
Indy Ignite
2.0
Omaha Supernovas
3.0
2
638
2026-05-08T00:00:00.000000Z
Dallas Pulse
3.0
San Diego Mojo
1.0
3
639
2026-05-09T19:00:00.000000Z
Dallas Pulse
3.0
Omaha Supernovas
2.0
Four teams made the playoffs, seeded 1 through 4 on regular-season record, in a single-elimination bracket: 1-seed vs. 4-seed, 2-seed vs. 3-seed, winners meet in the final. The No. 4 seed Omaha Supernovas beat the No. 1 seed Indy Ignite 3-2 in the semifinal, while the No. 2 seed Dallas Pulse handled the No. 3 seed San Diego Mojo in four sets to reach the final.
The semifinal upset
semifinal_query ="""SELECT team, SUM(kills) AS kills, SUM(attack_attempts) AS attempts, SUM(service_errors) AS service_errors, SUM(reception_errors) AS reception_errors, SUM(total_blocks) AS blocksFROM `maydaystats.mlv_volleyball.boxscores`WHERE schedule_event_id = 637GROUP BY team"""semifinal_team_totals = client.query(semifinal_query).to_dataframe()semifinal_team_totals = semifinal_team_totals.reset_index(drop=True)semifinal_team_totals.index +=1semifinal_team_totals
team
kills
attempts
service_errors
reception_errors
blocks
1
Indy Ignite
70.0
187.0
17.0
4.0
12.0
2
Omaha Supernovas
63.0
178.0
13.0
1.0
13.0
The team totals are the surprise: Indy Ignite actually out-hit Omaha in this match, 70 kills on 187 attempts to Omaha’s 63 kills on 178 attempts, and blocking was close, 12 to 13. Indy lost the match anyway, and the reason shows up in two other columns rather than hitting: Indy committed 17 service errors and 4 reception errors, against Omaha’s 13 and 1. Four extra free points from bad passing on top of four extra serves into the net or out of bounds accounts for most of the margin in a match that went the full five sets.
The individual swing goes the other way. Leketor Member-Meneh came in averaging 9.7 kills a match on a .367 hitting percentage all season, Indy’s second-most productive hitter behind Azhani Tealer. Against Omaha she went 6-for-22, a .273 clip on well below her usual number of swings. Omaha, meanwhile, got a night nobody could have projected from its bench: Janice Leao entered the match averaging 1.6 kills and 1.3 blocks per match on a .344 hitting percentage for the season, and went 10-for-17 (.588) with 4 blocks, by a wide margin her best match of the year, in the one match her team needed it most.
Dallas Pulse beat Omaha Supernovas 3-2 in the final to win the title, powered by Diaz Maldonado’s 26 kills and 27 points, a clean encore of the two-hitter attack that carried the team all season. The runner-up’s semifinal upset ran out of steam one match short of the trophy.
What’s next
This covers the season at a high level: the league leaderboards, the regular-season standings, and the playoff bracket itself. The same table supports much narrower questions too, like a single hitter’s efficiency swings across the two scoresheet eras, or how a team’s block numbers held up on the road. Those are posts for another day, now that a full season of validated data is sitting in BigQuery.
Every match row in this dataset carries a checksum_ok flag: the pipeline sums each parsed player’s stats and cross-checks the total against the scoresheet’s own printed team total, and flags anything that doesn’t match exactly rather than trusting it silently. 88 of the 99 matches in the dataset check out clean; the other 11 are flagged for a small, isolated discrepancy in one column (attack attempts) that traces back to the scoresheet’s own printed total rather than a parsing error - see the pipeline’s DEPLOY.md for the full investigation. Nothing in this post depends on that column, but a query that does should filter WHERE checksum_ok.
Like the other posts on this site, this one uses Quarto’s frozen execution (freeze: auto): the queries above ran once, locally, against BigQuery, and the deployed site reuses that committed output rather than re-querying on every build.